➜ ~ gops help memstats gops is a tool to list and diagnose Go processes.
Usage: gops <cmd> <pid|addr> ... gops <pid> # displays process info gops help # displays this help message
Commands: stack Prints the stack trace. gc Runs the garbage collector and blocks until successful. setgc Sets the garbage collection target percentage. memstats Prints the allocation and garbage collection stats. version Prints the Go version used to build the program. stats Prints runtime stats. trace Runs the runtime tracer for 5 secs and launches "go tool trace". pprof-heap Reads the heap profile and launches "go tool pprof". pprof-cpu Reads the CPU profile and launches "go tool pprof".
All commands require the agent running on the Go process. "*" indicates the process is running the agent.
➜ ~ gops stats 68125 goroutines: 3 OS threads: 12 GOMAXPROCS: 8 num CPU: 8
trace
获取当前运行5s的trace信息,会打开网页:
1 2 3 4 5 6
➜ ~ gops trace 68125 Tracing now, will take 5 secs... Trace dump saved to: /var/folders/5g/rz16gqtx3nsdfs7k8sb80jth0000gn/T/trace116447431 2020/03/16 10:23:37 Parsing trace... 2020/03/16 10:23:37 Splitting trace... 2020/03/16 10:23:37 Opening browser. Trace viewer is listening on http://127.0.0.1:55480
cpu profile
获取cpu profile,并进入交互模式:
1 2 3 4 5 6 7 8 9 10 11 12 13 14 15 16
➜ ~ gops pprof-cpu 68125 Profiling CPU now, will take 30 secs...
Profile dump saved to: /var/folders/5g/rz16gqtx3nsdfs7k8sb80jth0000gn/T/profile431166544 Binary file saved to: /var/folders/5g/rz16gqtx3nsdfs7k8sb80jth0000gn/T/binary765361519 File: binary765361519 Type: cpu Time: Mar 16, 2020 at 10:25am (CST) Duration: 30s, Total samples = 0 No samples were found with the default sample value type. Try "sample_index" command to analyze different sample values. Entering interactive mode (type "help" for commands, "o" for options) (pprof) (pprof) top Showing nodes accounting for 0, 0% of 0 total flat flat% sum% cum cum%
➜ ~ gops pprof-heap 68125 Profile dump saved to: /var/folders/5g/rz16gqtx3nsdfs7k8sb80jth0000gn/T/profile292136242 Binary file saved to: /var/folders/5g/rz16gqtx3nsdfs7k8sb80jth0000gn/T/binary693335273 File: binary693335273 Type: inuse_space Time: Mar 16, 2020 at 10:27am (CST) No samples were found with the default sample value type. Try "sample_index" command to analyze different sample values. Entering interactive mode (type "help" for commands, "o" for options) (pprof) (pprof) traces File: binary693335273 Type: inuse_space Time: Mar 16, 2020 at 10:27am (CST) -----------+------------------------------------------------------- bytes: 256kB 0 compress/flate.(*compressor).init compress/flate.NewWriter compress/gzip.(*Writer).Write runtime/pprof.(*profileBuilder).build runtime/pprof.profileWriter -----------+------------------------------------------------------- bytes: 64kB 0 compress/flate.newDeflateFast compress/flate.(*compressor).init compress/flate.NewWriter compress/gzip.(*Writer).Write runtime/pprof.(*profileBuilder).build runtime/pprof.profileWriter -----------+-------------------------------------------------------
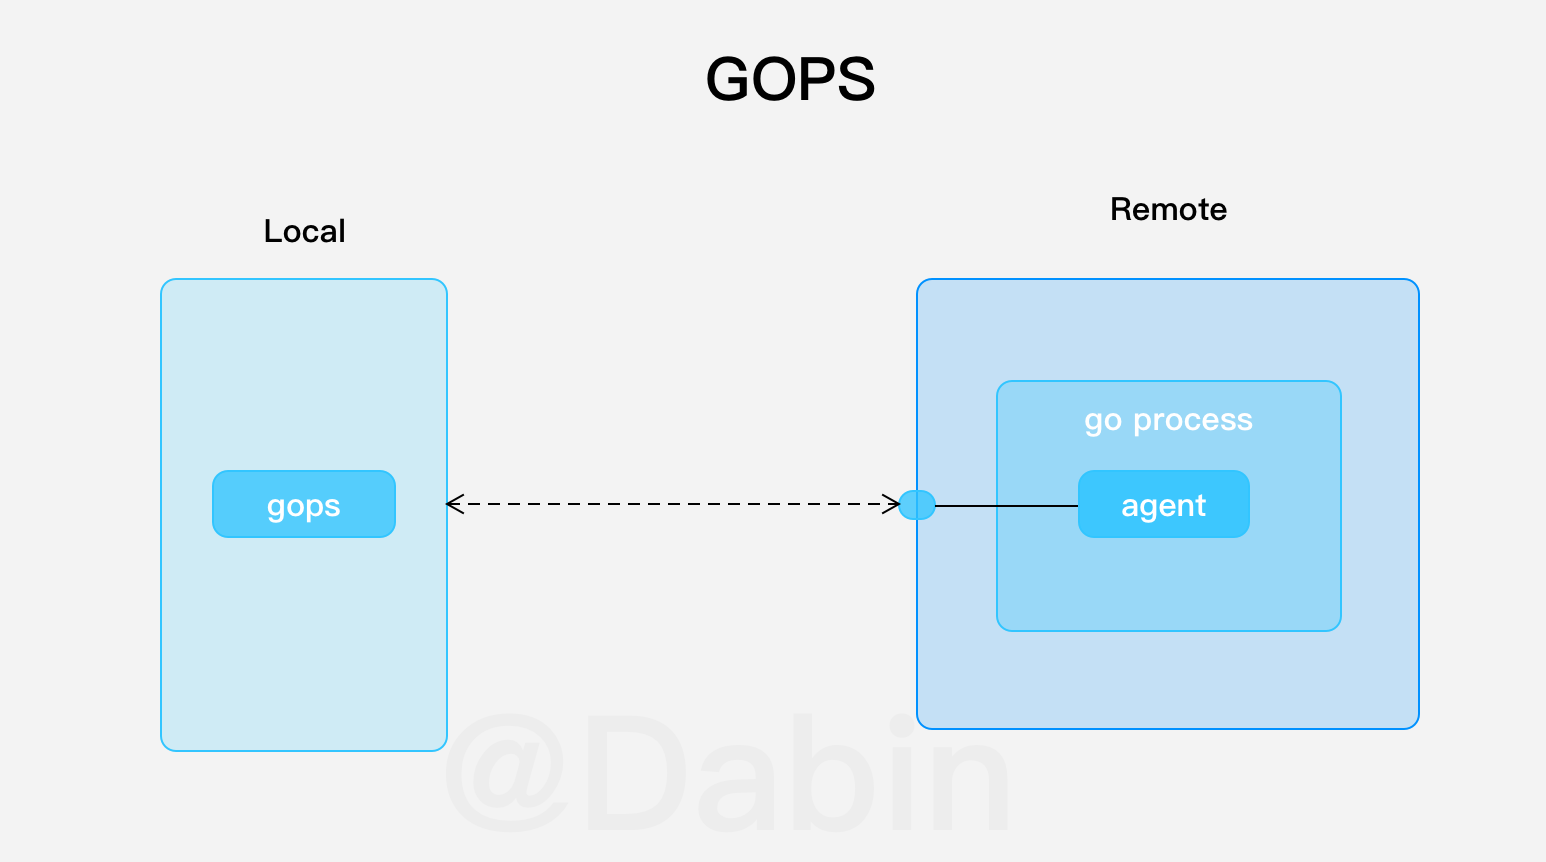
使用远程连接
agent的默认配置Option{},监听的是环回地址。
1
2
3
4
5
➜ ~ sudo netstat -nap | grep 414 ➜ ~ netstat -nap | grep `pgrep gopsexample` (Not all processes could be identified, non-owned process info will not be shown, you would have to be root to see it all.) tcp 0 0 127.0.0.1:36812 0.0.0.0:* LISTEN 414/./gopsexample
修改程序,在Option中设置监听的地址和端口:
1
agent.Listen(agent.Options{Addr:"0.0.0.0:8848"})
在远程主机上重新编译、重启进程,确认进程监听的端口:
1 2 3 4
➜ ~ netstat -nap | grep `pgrep gopsexample` (Not all processes could be identified, non-owned process info will not be shown, you would have to be root to see it all.) tcp6 0 0 :::8848 :::* LISTEN 887/./gopsexample
在本地主机上使用gops连接远端go进程,并查看数据:
1
2
3
4
5
➜  ~ gops stats 192.168.9.137:8848
goroutines: 3
OS threads: 9
GOMAXPROCS: 4
num CPU: 4