轻松入门Golang pprof实用不忽悠
网上已搜索golang pprof,资料不少,简明高效的一个没看到,这篇文章5步教你用会pprof获取cpu和内存prof。
第1步:安装易用的pprof
golang自带的prof包是runtime/pprof,这个是低级别的,需要你手动做一些设置等等周边工作,不利于我们快速上手,利用pprof帮助我们解决实际的问题。这里推荐davecheney封装的pprof,它可以1行代码,让你用上pprof,专心解决自己的代码问题,下载:
1 | go get github.com/pkg/profile |
第2步:安装graphviz
pprof生成的prof文件时二进制的,需要把这个二进制的文件转换为我们人类可读的,graphviz可以帮助我们把二进制的prof文件转换为图像。Mac安装:
1 | brew install graphviz |
其他系统安装参考这里Graphviz Download。
第3步:修改你的main函数
只需要为hi.go增加这一行,defer profile.Start().Stop(),程序运行时,默认就会记录cpu数据:
1 | package main |
第4步:编译运行你的函数
编译和执行hi.go。
1 | go build hi.go |
应当看到类似的结果,它输出了生成的cpu.pprof的路径:
1 | 2018/11/07 19:47:21 profile: cpu profiling enabled, /var/folders/5g/rz16gqtx3nsdfs7k8sb80jth0000gn/T/profile046201825/cpu.pprof |
第5步:可视化prof
可视化有多种方式,可以转换为text、pdf、svg等等。text命令是
1 | go tool pprof --text /path/to/yourbinary /var/path/to/cpu.pprof |
结果是:
1 | go tool pprof -text ./hi /var/folders/5g/rz16gqtx3nsdfs7k8sb80jth0000gn/T/profile046201825/cpu.pprof |
还有pdf这种效果更好:
1 | go tool pprof --pdf /path/to/yourbinary /var/path/to/cpu.pprof > cpu.pdf |
例子:
1 | go tool pprof -pdf ./hi /var/folders/5g/rz16gqtx3nsdfs7k8sb80jth0000gn/T/profile046201825/cpu.pprof > cpu.pdf |
效果:

5步已经结束,你已经学会使用cpu pprof了吗?
轻松获取内存pprof
如果你掌握了cpu pprof,mem pprof轻而易举就能拿下,只需要改1行代码:
1 | defer profile.Start(profile.MemProfile).Stop() |
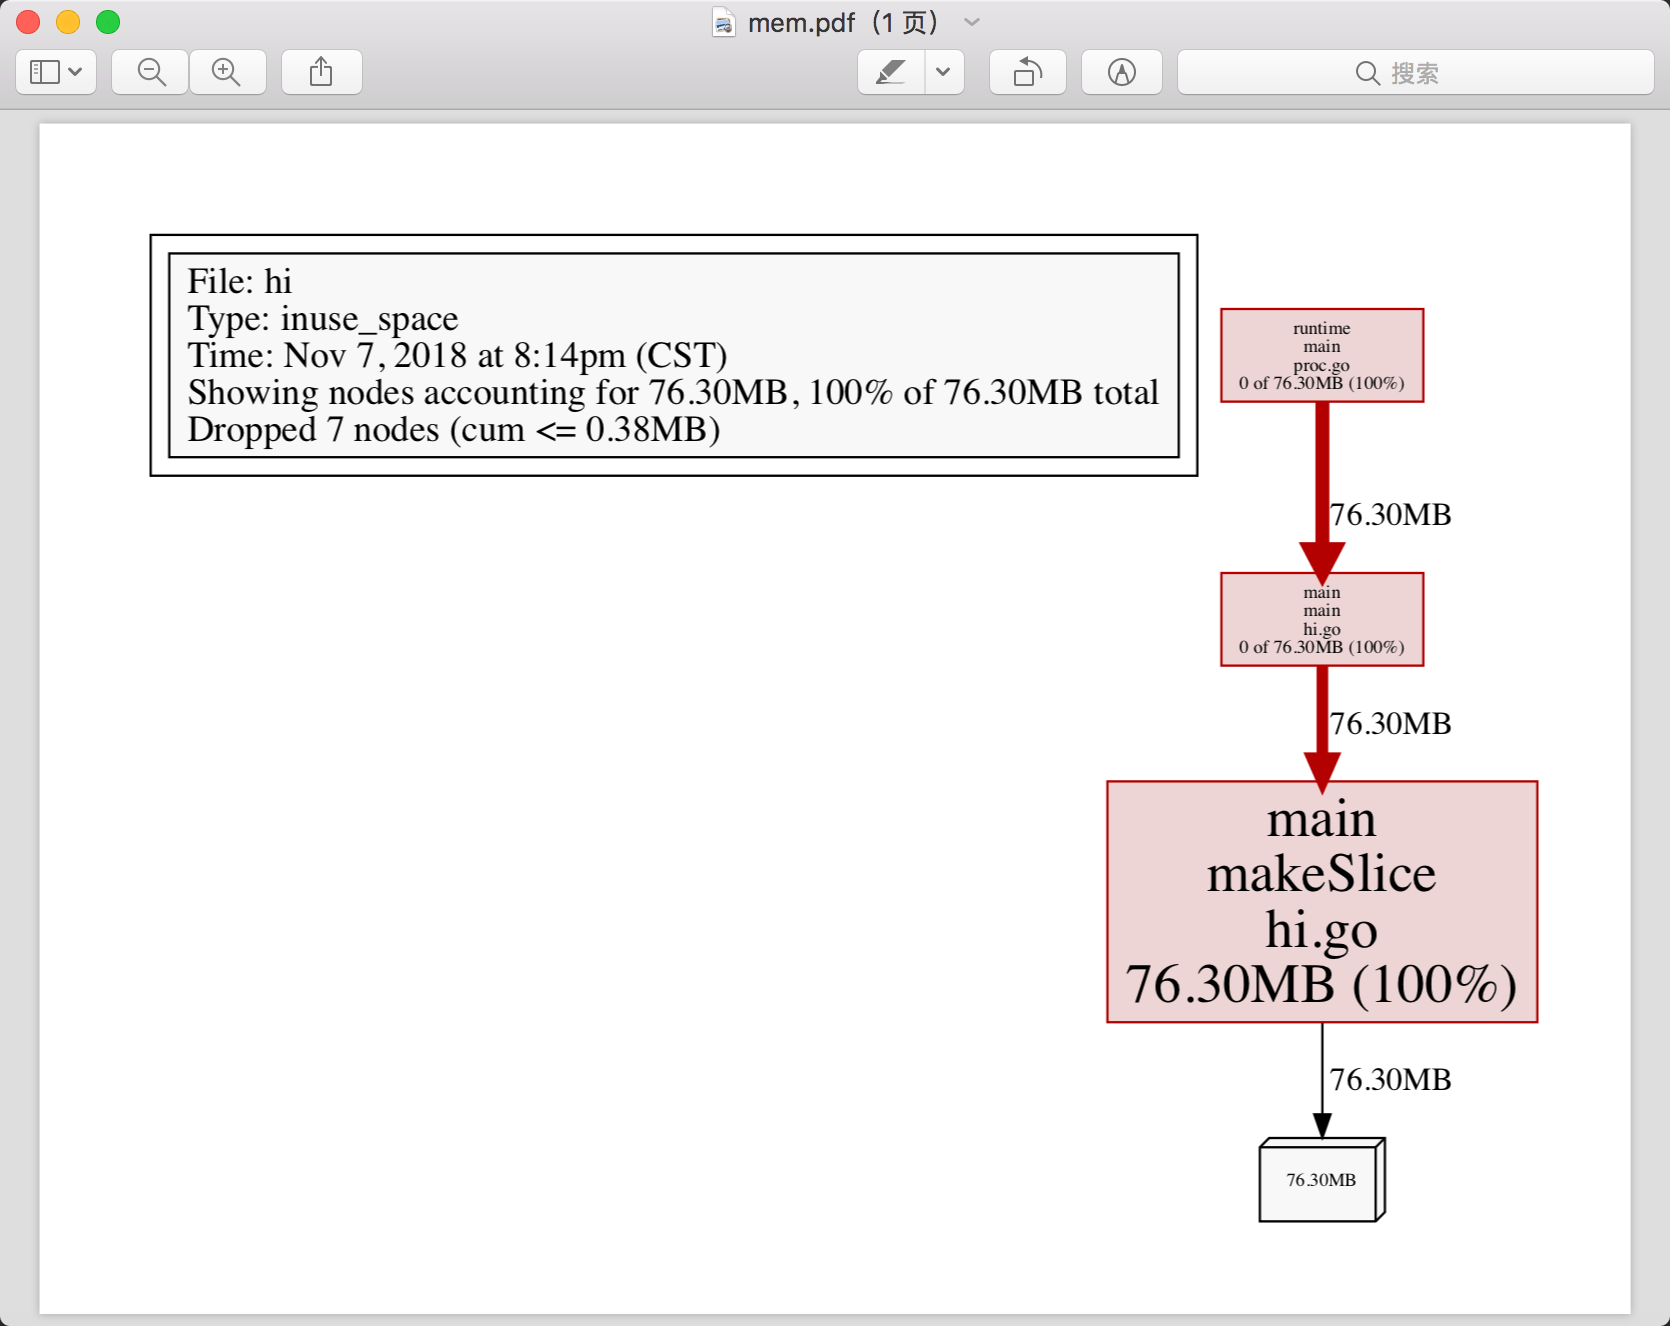
效果:
1 | go tool pprof -pdf ./hi /var/folders/5g/rz16gqtx3nsdfs7k8sb80jth0000gn/T/profile986580758/mem.pprof > mem.pdf |
- 如果这篇文章对你有帮助,不妨关注下我的Github,有文章会收到通知。
- 本文作者:大彬
- 如果喜欢本文,随意转载,但请保留此原文链接:http://lessisbetter.site/2018/11/07/Golang-pprof-step-by-step/